
The Equity Analytics component provides key data on the security’s recent performance, profile, financial statements, dividends & capital changes, ratios and trading details (i.e. day high/low).
Inside Equity Analytics, the following components are included:
- Company Profile: Display the company description, fundamental data, clearing codes, management, and key reporting dates.
- Analyst Evaluations: Aggregates of analysts’ strong buy, buy, hold, sell, and strong sell recommendations for each of the subject companies on a scale of one to five. It also gives you their target price and the maximum difference to the price they are willing to accept to carry out their transaction. Analyst assessment is shown for the next five quarters of the company, showing the change each analyst made from their initial analysis. The data is provided for informational purposes only. Neither the Toronto-Dominion Bank nor TD Waterhouse Canada Inc. endorses or recommends the purchase or sale of any security described here*.
- Financial Statements: Display the company’s balance sheet, profit and loss statement, and cash flow calculation.
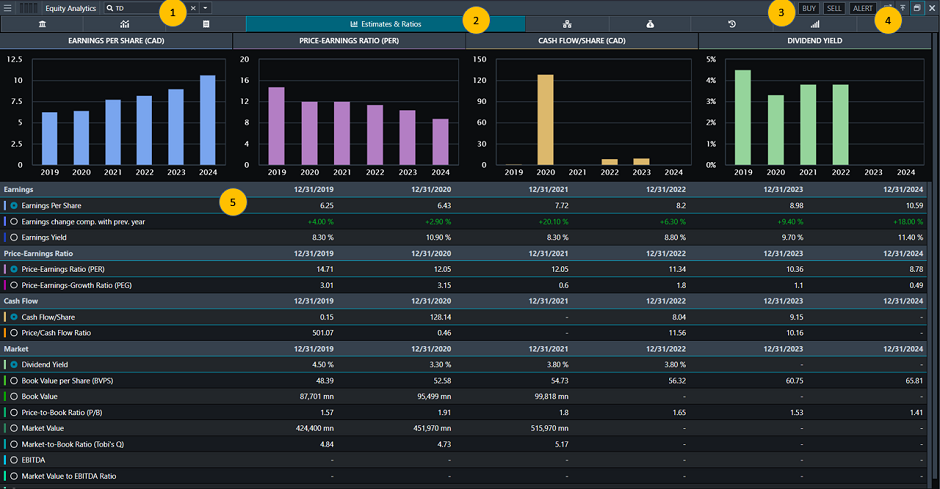
- Estimates & Ratios: Display the company’s historical and future estimates for ratios based on earnings, price-earnings, cash flow, and market. In addition to showing market value, book value, yield, and changes compared to the previous year.
- Relative Performance: Display comparison of the company’s relative performance, correlation and beta values against various indices.
- Dividends & Capital Changes: Display the company’s historical dividend payments (including announcement, ex-dividend and payment date) and capital changes.
- Time & Sales: Display list of trades with their Size, Date and Time, Price, Conditions, and Buyer and Seller ID.
- Trade History: Display the Open, High, Low, Close and Volume of the security within a range of dates customizable with the interval shown in the dropdown menu.
- Trade Summary: Display the company’s fundamental data, including market trends, trade history and additional abstract details such as the number of shares outstanding. A chart is shown alongside the data, able to choose between the absolute, relative, and log view of the prices in an adjustable period.
*The Toronto-Dominion Bank and TD Waterhouse Canada Inc. shall not be liable to you or to others for any loss, damage or injury of any type caused or contributed to in any way by your use or reliance on such information.