
5. Comparative Analysis
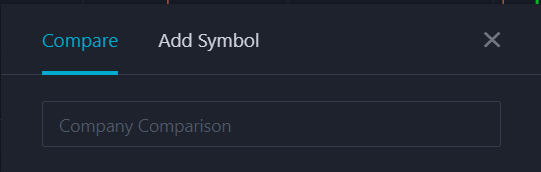
Compare the firm up to multiple companies by entering its respective symbol/ticker to view their charts
6. Add Indicators
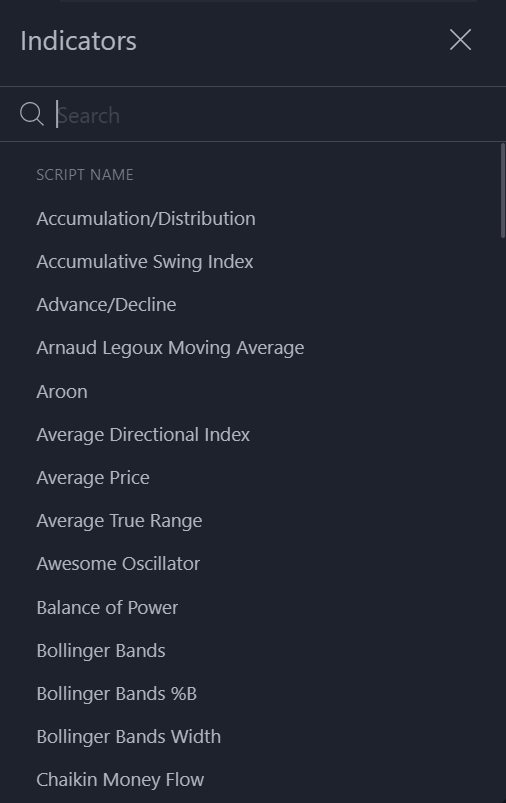
Select a menu of over 100 indicators from the dropdown menu to ad to your Chart. You can search the indicator you want by using the search bar
7. Add Templates
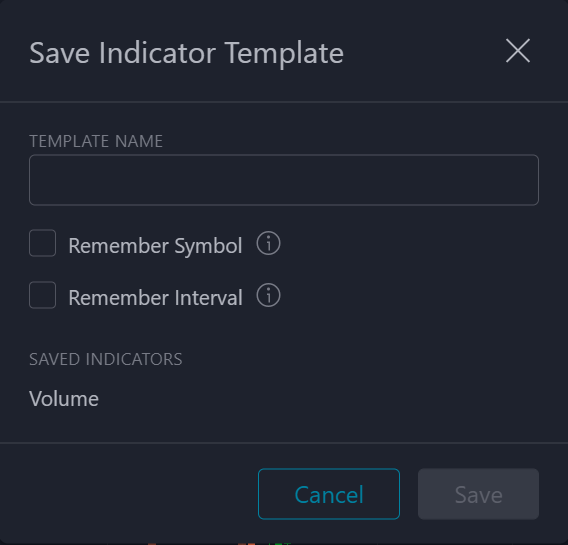
Save the current indicators on your chart as a template.
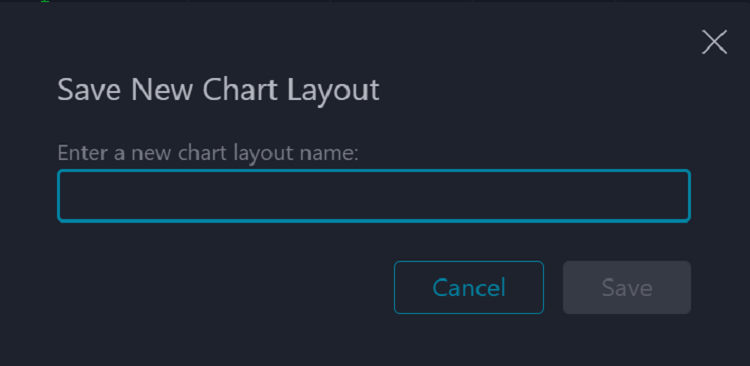
10. Save the current layout (the keyboard shortcut beside the option) or load a past layout. The following pop-up will appear, allowing you to name the chart layout you choose to save.
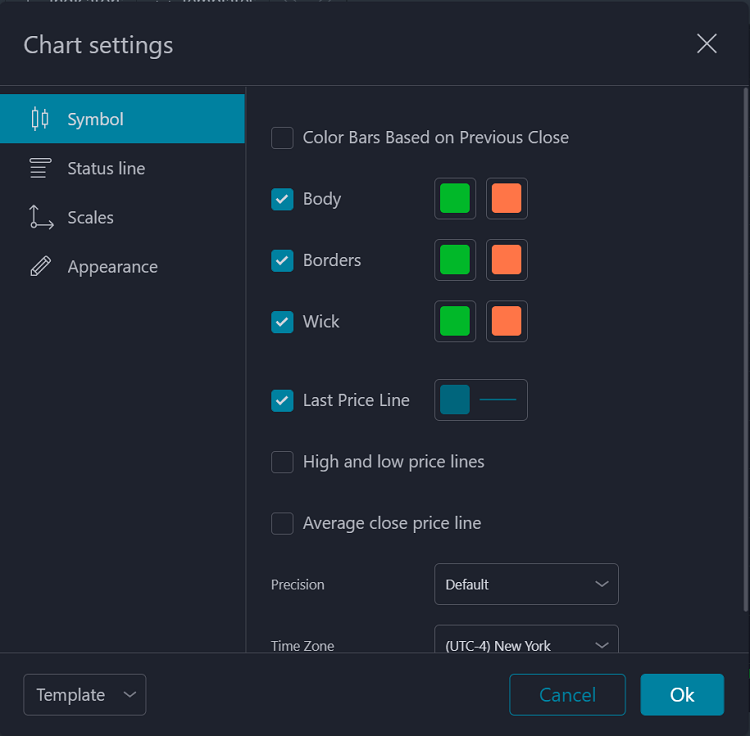
11. Customize the Chart by clicking on the Gear Icon.
14. Indicators and additional comparable symbols will appear here. By clicking on the settings, you can adjust the style and parameters. The eye allows you to show/hide the overlaying line. Click on the ‘X’ icon to delete the indicator or added symbol.
Additional Details
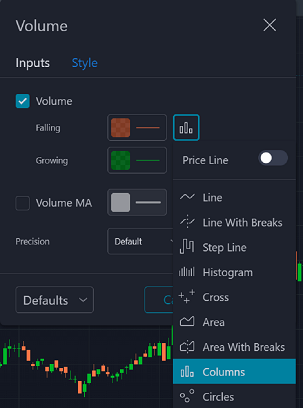
- Click on the price line switch to toggle between on and off.
- Adjust and customize the Inputs parameters
- Customize the chart by choosing the colour, shade, line, and precision
- Save your customized edits as the default template or reset the settings by selecting from the Defaults dropdown menu
- Select the style (e.g. Line, Area, and Circles) of the chart in the dropdown menu after clicking on the icon.
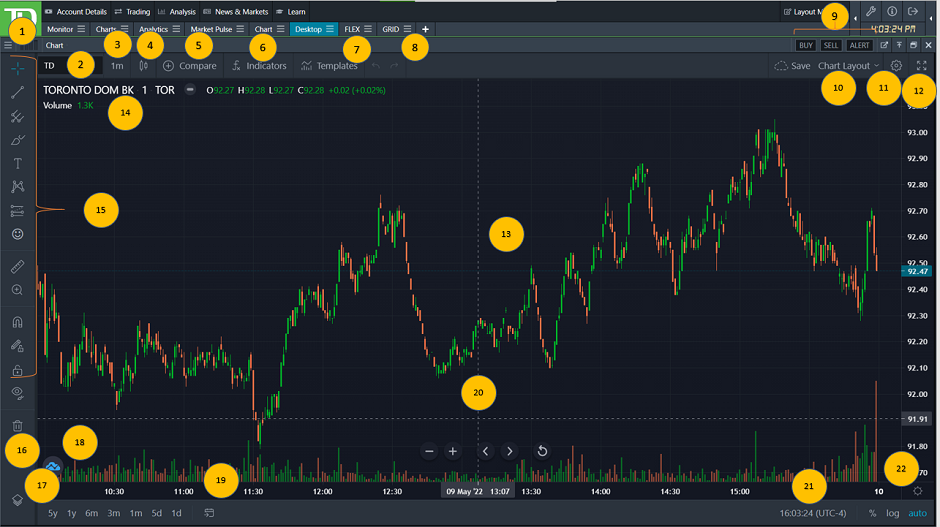
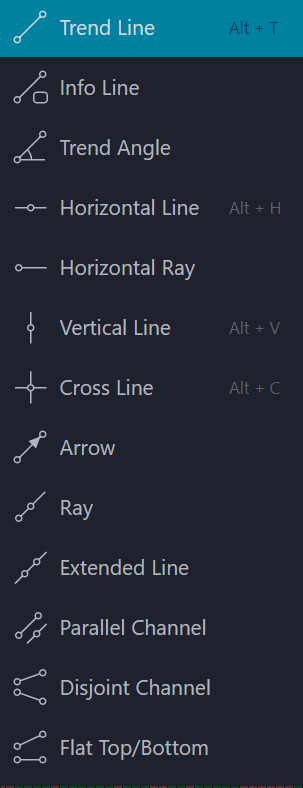
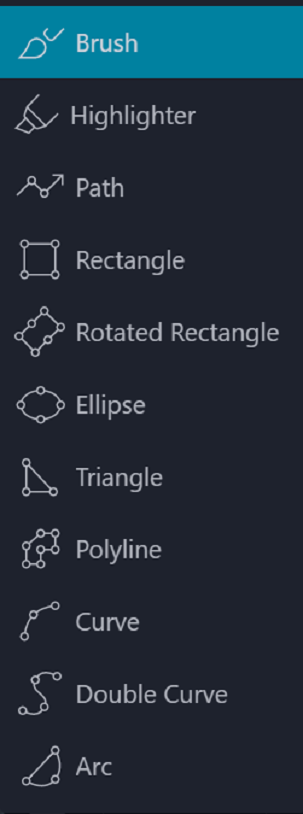
15. Drawing Tools
Add drawings to your charts by selecting from dropdown menu after clicking on an icon. Here are a few example:
| Lines | Strategic Trading tools | Text Boxes and Bubbles | Technical Analysis | Risk Management |
 | 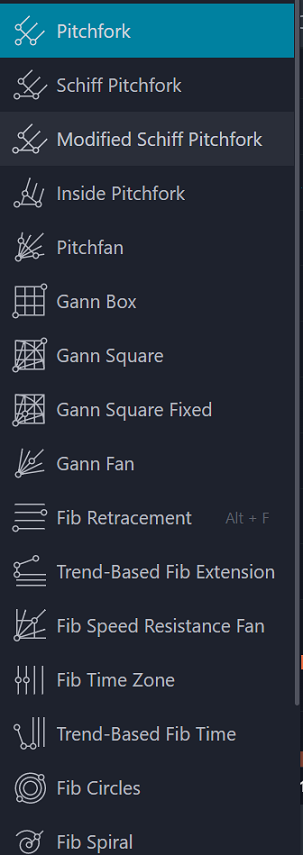 | 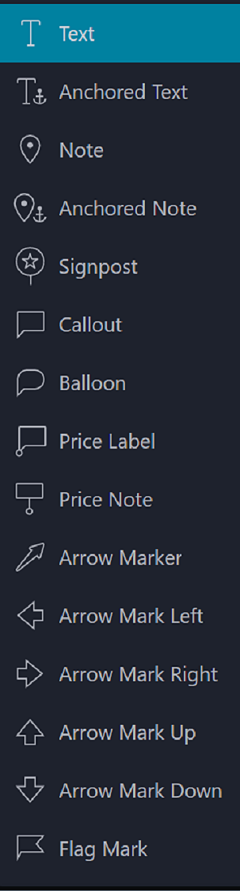 | 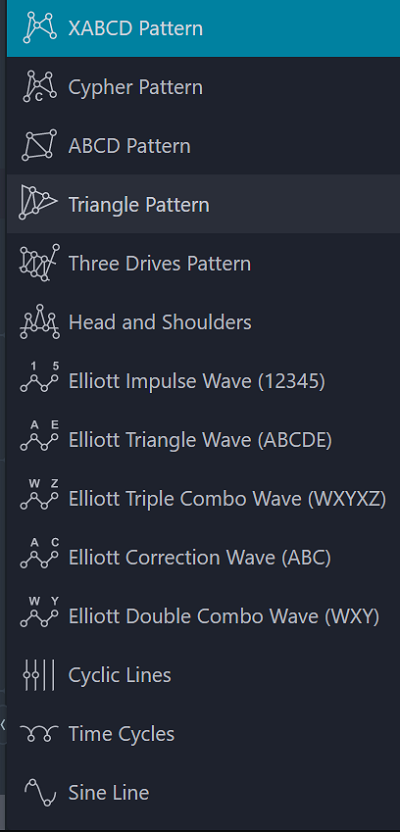 | 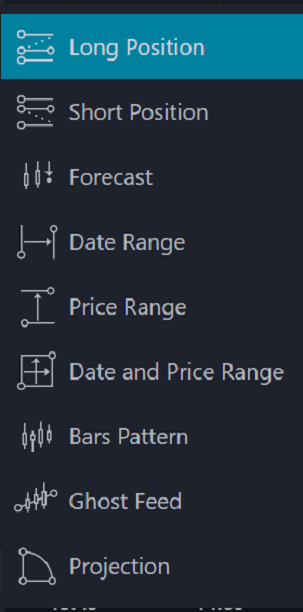 |
Draw with your mouse or adjust the shapes. You can customize the settings with the bar, such as choosing the colour. You can move this bar by clicking and dragging on the button on the left corner.
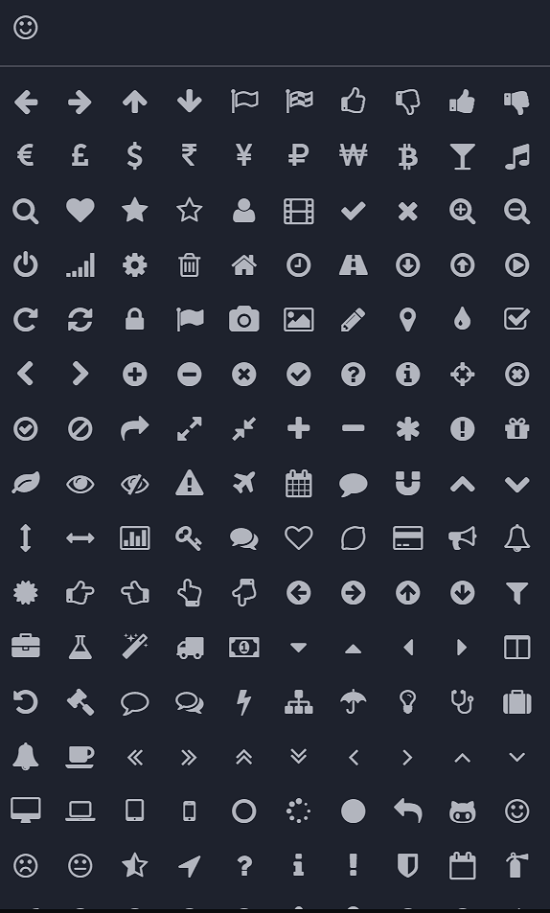
Add symbols to your chart to personalize and mark important points.
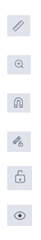
Use a ruler to measure a section in the chart.
Zoom in and out to view different time periods on the chart.
Select between Weak and Strong for the Magnet.
Stay/Leave Drawing Mode.
Lock/Unlock All Drawing Tools.
Show/Hide All Drawing Tools.
17. Object Tree
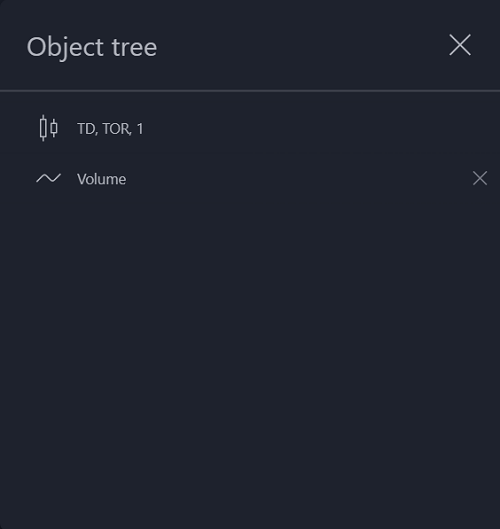
- Lock the object into the chart to prevent any changes
- Click on the eye to show/hide the object and settings to customize the object
- Remove the object by clicking on the ‘X’ icon
- You can alter the layers by switching the order of the objects
- Click and drag the button on left corner of each bar
- Filter by All, Drawings, and Studies in dropdown menu located near upper right corner of the window.
20. Hover to view navigation controls.
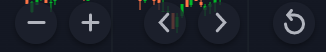
Click on the +/- icon to zoom in and out, travel across the time period by using the arrows, and reset the Chart to its default settings using the undo icon.
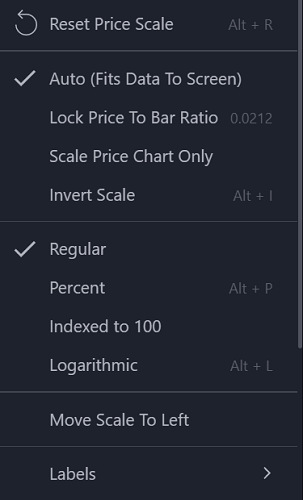
22. Click to view an additional menu to customize chart settings.
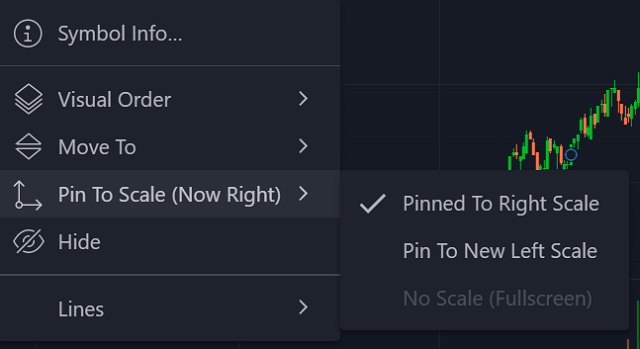
Right-Click Menu:
Right-click on the screen to access these menus. You can move the pane to a New Pane Above, Existing Pane Below, New Pane Below.
Disclaimer
Probability metrics are modelled by Thomson Reuters and leverage market information such as security price, dividend yield, interest rates, day to expiry and implied volatilities derived from option prices to arrive at their calculation.
Probability analysis results are theoretical in nature, not guaranteed, and do not reflect any degree of certainty of an event occurring for any security. These metrics and results are not reviewed or endorsed by TD Waterhouse Canada Inc., The Toronto-Dominion Bank or its subsidiaries.