
The Bubble Chart component provides a visual comparison of prevalent firms in the market using real-time data to make it easy to analyze and identify general trends. Scroll to zoom in and out. You can view the default display again by clicking on the Reset zoom button.
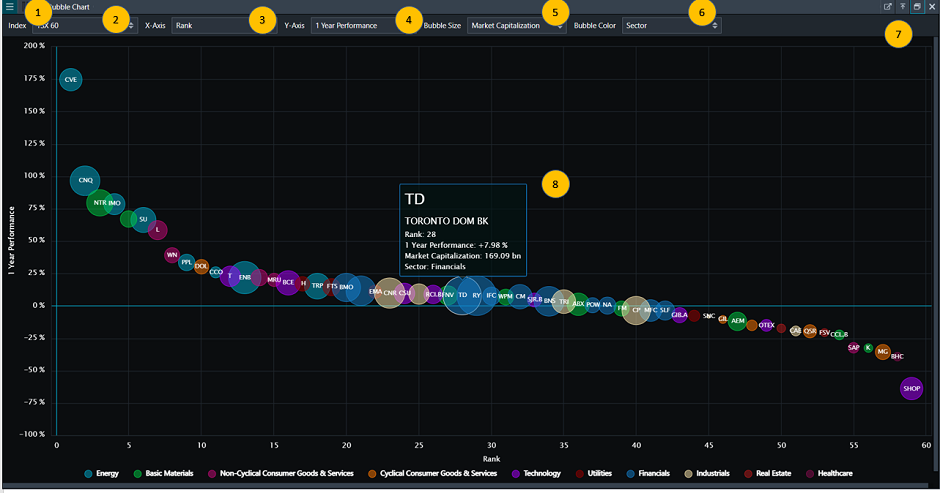
- Click to Add Symbols to Watchlist.
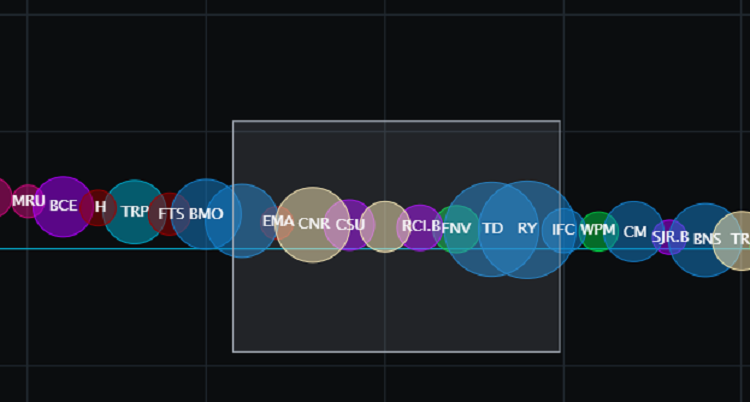
Note: Add Symbols to Watchlist will appear if you click on a bubble or click and drag to create a rectangular area to select multiple symbols. Click outside the area